Social Justice Report 2003: Appendix one: A statistical overview of Aboriginal and Torres Strait Islander peoples in Australia
Social Justice Report 2003
Appendix one: A statistical overview of Aboriginal and Torres Strait Islander peoples in Australia
- Introduction
- Population figures
- Indigenous households and familiesLanguage
and culture - Health
- Income
- Employment
- Education
- Housing and homelessness
- Aboriginal and Torres Strait Islanders
and criminal justice systems - Child protection
- Further Information and Links
Introduction
This collection of statistics has been chosen
for their relevance in highlighting the key characteristics of the Indigenous
population. It focuses on key areas such as health, education, employment,
housing, and contact with criminal justice and welfare systems. Where
possible, the data is presented in a way that identifies absolute and
relative change in the situation of Indigenous peoples over the past five
and ten years, and provides some international comparisons.
While reducing people and their experiences
to percentages and numbers is problematic, statistics are useful as indicators
of disparities and inequalities, and of similarities, between Indigenous
and non-Indigenous Australians. The statistics reproduced are intended
to be representative of the current situation, although not exhaustive
or comprehensive.
The main source of information used is the
Australian Bureau of Statistics (ABS) and the Census data, various surveys
and data collection projects that it undertakes . Recently, the Steering
Committee for the Review of Government Service Provision has also released
the first national report on key indicators for overcoming Indigenous
disadvantage which draws together data collected across all levels of
government 2.
Compiling an accurate profile of Aboriginal
and Torres Strait Islander peoples remains an ongoing task. There are
a range of different limitations in current collections of census, survey
and administrative data which must be borne in mind.
Aboriginal and Torres Strait Islanders were
first counted as citizens in the 1971 Census 3.
Since then, censuses have shown a significant increase in people identifying
as Aborigines and/or Torres Strait Islanders. These increases cannot be
accounted for by the birth rate alone. Between the 1991 and 1996 Census
there was a 33% increase recorded in Australia's Aboriginal and Torres
Strait Islander population, while between the 1996 and 2001 Census there
was a 16% increase. In contrast, the total population in Australia increased
by five per cent between 1991 and 1996 and four per cent from 1996 - 2001.
The ABS attributes the increase to a growing propensity of people to identify
as Aboriginal and/or Torres Strait Islander, and the greater efforts made
to record Aboriginal and Torres Strait Islander people in the censuses.
Because of the recorded increases in the
Aboriginal and Torres Strait Islander population, the ABS has warned that
comparisons made between two censuses must be made with caution. They
recommend comparing percentages from two censuses, rather than directly
comparing counts or numbers4 .
Despite the increases in people identifying
as Aboriginal and Torres Strait Islander in censuses, however, there are
still believed to be significant undercounts of Aboriginal and Torres
Strait Islander people occurring. Identifying as Aboriginal and Torres
Strait Islander, or any other group, is voluntary. In the 2001 Census,
Aboriginal and Torres Strait Islander status is unknown for 767,757 people
who completed the census questionnaire: that is 4.1% of the total population.
Because some of these people will be Aboriginal and/or Torres Strait Islander
the ABS calculates what it calls 'experimental estimates' to give a figure
for the 'true' size of the Aboriginal and Torres Strait Islander population.
It is important to distinguish actual counts from censuses from the experimental
estimates.
Population figures
(a) Size and growth of the Indigenous population
Table 1 below shows that 410,000 people
identified as of Aboriginal and/or Torres Strait Islander origin in the
2001 Census. This was a 16% increase since the 1996 Census. The ABS estimate
that three-quarters of this growth over the five years from 1996-2001
can be explained by demographic factors (births and deaths), with the
remaining increase the result of other factors (such as improved Census
collection methods and increased tendencies of people to identify as Indigenous). 5
Table 1: Census count of Indigenous
population, 1991-20016
| 1991 | 1996 | 2001 | |
| Recorded by the Census | 265,500 | 353,000 | 410,000 |
| Increase on previous census (per cent) | 17.0 | 33.0 | 16.0 |
| % of the total population (per cent) | 1.6 | 2.0 | 2.2 |
Due to the undercount in Aboriginal and
Torres Strait Islander people believed to occur in the census, the ABS
has estimated that the Aboriginal and Torres Strait Islander population
in 2001 was 458,500 people or 2.4% of the total Australian population7 . There were approximately 409,729 people of Aboriginal origin and 29,239
of Torres Strait Islander origin. A further 19,552 people identified as
of both Aboriginal and Torres Strait Islander origin. 8 There are slightly more women (231,000) than men (227,500) in the Aboriginal
and Torres Strait Islander population. This is a similar distribution
to the non-Indigenous population. 9
The Aboriginal and Torres Strait Islander
population is growing faster than the non-Indigenous population. The annual
rate of growth for Indigenous people has been estimated at 2.3% compared
with approximately 1.2% for non-Indigenous people. 10 It is estimated that the Indigenous population will grow to more than
550,000 by the year 2011. 11
(b) Age structure of the Aboriginal and Torres Strait
Islander Population
Aboriginal and Torres Strait Islander peoples
have a different population age structure to the rest of the Australian
population. In common with many other 'western' nations, the non-Indigenous
population of Australia is rapidly ageing, whereas the Indigenous population
is facing increased growth in young age groups. Table 2 below demonstrates
the different age structures of Indigenous and non-Indigenous Australians.
Table 2: Proportion of Indigenous and
non-Indigenous population in specific age groups, 200112
| Age group | 0 - 4 | 5 - 14 | 15 - 24 | 25 - 44 | 44 - 64 | 65 + |
| Indigenous: % of population |
13.1 | 25.8 | 18.4 | 28.1 | 11.8 | 2.9 |
| Non-Indigenous: % of population |
6.4 | 13.6 | 13.6 | 30.2 | 23.4 | 12.8 |
The Indigenous population is considerably
younger than the non-Indigenous population. The median age for Indigenous
people is 20 years, whereas it is 35 years for non-Indigenous Australians.
There are also relatively fewer Aboriginal and Torres Strait Islander
people aged 65 or over.
(c) Where Aboriginal and Torres Strait Islander people
live
Almost 60% of Aboriginal and Torres Strait
Islander population lived in two states in 2001: New South Wales and Queensland.
Despite this, Aboriginal and Torres Strait Islander people make up a small
minority of the total population of these States (2.1% and 3.5% respectively).
As a proportion of the total population, Aborigines and Torres Strait
Islanders constitute 28.8% of people in the Northern Territory. 13 Table 3 below details the percentage of the Indigenous population that
lives in each state and territory, and the proportion of each state and
territory that is Indigenous.
Table 3: Location of Aboriginal and
Torres Strait Islander Peoples - by State and Territory14
|
|
Percentage of the Aboriginal and Torres Strait Islander population living in a State or Territory |
Percentage of the Non-Indigenous population living in a State or Territory |
Percentage of the State or Territory population that is Aboriginal and Torres Strait Islander |
| NSW |
29.4
|
34
|
2.1
|
| Vic |
6.1
|
25.2
|
0.6
|
| Qld |
27.5
|
18.5
|
3.5
|
| SA |
5.6
|
7.8
|
1.7
|
| WA |
14.4
|
9.7
|
3.5
|
| Tas |
3.8
|
2.4
|
3.7
|
| NT |
12.4
|
0.7
|
28.8
|
| ACT |
0.9
|
1.7
|
1.2
|
Most Torres Strait Islanders (86.2%) live
on mainland Australia, with 13.8% living in the Torres Strait region.
58.4% of the Torres Strait Islander population
live in the state of Queensland and a further 18.3% in NSW. 15
(d) Remoteness
While the majority of Indigenous people
live in either major cities, inner or outer regional areas of Australia,
the proportion of people that live in remote or very remote areas is much
higher than for the non-Indigenous population. Table 4 below illustrates
that 30% of Indigenous people live in major cities, as opposed to 67%
of the non-Indigenous population; with over 26% of Indigenous people living
in remote or very remote areas, which compares to just two per cent of
the non-Indigenous population. 16
Table 4: Location of Aboriginal and
Torres Strait Islander population by remoteness1
| Aboriginal and Torres Strait Islander |
Non-Indigenous | |
| Major cities | 30.2% | 67.2% |
| Inner regional | 20.3% | 20.7% |
| Outer regional | 23.1% | 10.1% |
| Remote | 8.8% | 1.5% |
| Very remote | 17.7% | 0.5% |
Indigenous households and
families
An Indigenous household is defined by the
ABS as being one in which an Indigenous person was resident and present
on census night. These can be further classified as family, group or lone
person households. There were approximately 145,000 Indigenous households
recorded in the 2001 Census. Of these, the vast majority (78%) contained
one family. Of the remaining 22%, five per cent were multi-family households
and five per cent were group households. Approximately 13% of Aboriginal
and Torres Strait Islander people live in lone person households. 18
Couples with dependent children comprise
31% of Indigenous families, whereas 24% were one parent families (as opposed
to 10% of non-Indigenous families) and 23% were couples without children
(compared with 36% of non-Indigenous couples).
Aboriginal and Torres Strait Islander people
are more likely to live in one or multi-family households than non-Indigenous
people (82% compared with 70%) and less likely to live in lone person
households (13% compared with 24%).
Living arrangements vary according to remoteness.
For example, multi-family households increase with remoteness whereas
one parent families tend to live in major cities. 19
Language and culture
Aboriginal and Torres Strait Islander cultures
today reflect both traditional elements and the influence of non-Indigenous
cultures.
- 80% of Aboriginal and Torres Strait Islander people reported
speaking only English at home, which is about the same as the non-Indigenous
population. - 12% of Aboriginal and Torres Strait Islander people reported
speaking an Aboriginal and Torres Strait Islander language at home;
with three quarters of those recording they were also fluent in English. - Many Aboriginal and Torres Strait Islander people are
bilingual; however, the pattern varies with geographical location. 55%
of those living in remote areas reported speaking an Aboriginal and
Torres Strait Islander language, compared withone per centin urban centres. - Older Aboriginal and Torres Strait Islander people (over
45 years) are more likely to speak a language than younger people. - Aboriginal and Torres Strait Islander languages are more
likely to be spoken in the centre and north of Australia than in the
south. 20
In 1994, the NATSIS survey reported approximately
60% of Aboriginal and Torres Strait Islander people identified with a
clan, tribal or language group. 21
Health
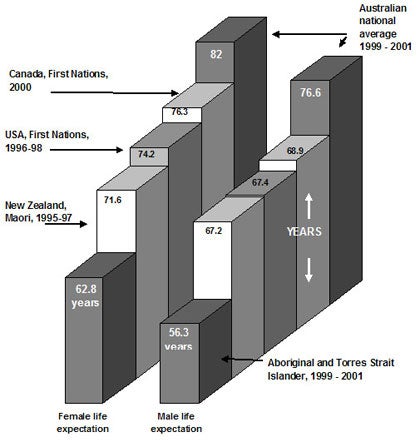
(a) Life expectancy
During 1999 - 2001, the Australian Bureau
of Statistics (ABS) estimated the adjusted life expectancy22 of Aboriginal and Torres Strait Islander newborn males to be 56.3 years
and 62.8 years for females. 23 Life expectation
for Indigenous males is similar to the life expectancy rate for the total
male population in 1901-1910. The rate for Indigenous females is similar
to the rate for the total female population in 1920-2224 .
For Indigenous females, the current life
expectancy rate is lower than that given in the United Nations Human Development
Index for India (63 years) and about the same as in sub-Saharan Africa
with AIDS factored out (62 years) according to the World Health Organisation25 . For Indigenous males, life expectancy is lower than the UN figure for
Myanmar (57 years), Papua New Guinea (57 years) and Cambodia (57.4 years). 26
There are issues relating to the quality
of data collected about life expectancy which make comparisons over time
difficult. Nationally such information is unobtainable because death certificate
data from New South Wales, Victoria and Queensland is unreliable before
1997 and due to changes in methods for calculating Aboriginal and Torres
Strait Islander life expectancy from 1997 onwards. 27 Table 4 and 5 below illustrate changes in life expectancy for Aboriginal
and Torres Strait Islanders and the general population since 1997.
These figures indicate that in the period
1997 - 2001, life expectation for Aboriginal and Torres Strait Islander
females decreased slightly from 63 to 62.8 years. For Aboriginal and Torres
Strait Islander males it increased from 55.6 to 56.3 years. 28 The disparity in life expectancy between Aboriginal and Torres Strait
Islander people and the general population in Australia increased over
the period 1997 - 2001. For males, the gap increased from 20.6 to 20.7
years and for females, from 18.8 to 19.6 years. 29
Table
5: Aboriginal and Torres Strait Islander life expectation compared with
that of the general population (males)
| Period | 1997 - 1999 | 1998 - 2000 | 1999 - 2001 |
| General population | 76.2 | 75.6 | 77 |
| Aboriginal and Torres Strait Islander | 55.6 | 56 | 56.3 |
| Difference | 20.6 years | 20.7 years | |
| Inequality gap | Increase of 0.1 year | ||
Table 6: Aboriginal and Torres Strait
Islander life expectation compared with that of the general population
(females)
| Period | 1997 - 1999 | 1998 - 2000 | 1999 - 2001 |
| General population | 81.8 | 82 | 82.4 |
| Aboriginal and Torres Strait Islander | 63.0 | 62.7 | 62.8 |
| Difference | 18.8 years | 19.6 years | |
| Inequality gap | Increase of 0.8 year | ||
(b) Life expectancy - Comparison with other Indigenous
peoples
Approximately thirty years ago, life expectancy
rates for Indigenous peoples in Canada, New Zealand and the United States
of America were similar to the rates for Aborigines and Torres Strait
Islanders in Australia. However, significant gains in life expectancy
have been made in the past two decades. 30 As shown on Graph 2 below, Australia has fallen significantly behind in
improving the life expectancy of Indigenous peoples. Although comparisons
should be made with caution (because of the way different countries calculate
life expectation) data suggests Aboriginal and Torres Strait Islander
males live between 8.8 and 13.5 years less than Indigenous males in Canada,
New Zealand and the USA. Aboriginal and Torres Strait Islander females
live between 10.9 and 12.6 years less than Indigenous females in these
countries.
Graph 1: Comparisons
of life expectancy for Indigenous peoples in Australia, Canada, New Zealand
and the United States of America31
(c) Median age at death, 1990 - 2001
Median death age is the age at which half
of a population group will have died. In 2001, the median death age of
Indigenous people (male and female combined) was 54 years, around 24 years
less than that in the general population. 32 Graphs 2 and 3 below show that while the median death age for the general
population has increased steadily over the past decade, the Aboriginal
and Torres Strait Islander age has fluctuated. This in part reflects data
quality issues such as the smaller population samples involved and the
changing proportion of people being identified as Indigenous on death
certificates.
Graph
2: Median age at death (male), 1990 - 200133
In 2001, Aboriginal and Torres Strait Islander
males had a median death age of 52 years. It was highest in New South
Wales (56 years) and lowest in the Northern Territory (45 years). 34
Graph 3: Median age at death (female)
1990 - 200135
In 2001, Aboriginal and Torres Strait Islander
females had a median death age of 58 years in 2001. It was highest in
Victoria (64 years) and lowest in the Northern Territory (53 years). 36
(d) Infant health - Low Birth weight babies
A low birth weight baby weighs less than
2500 grams at birth. 37 Connections have
been made between low birth weight and life-long health impacts including
coronary heart diseases, type 2 diabetes, central obesity and hypertension.
All of these are highly prevalent among Indigenous adults. 38
Despite gains made in the 1980s, the number
of low birth weight babies born to Aboriginal and Torres Strait Islander
women has increased over the late 1990s. It is presently double the non-Indigenous
average as set out in Graph 4. 39 In the
same period, there have also been increases in low birth weight babies
born to non-Indigenous women (from 6.2 to 6.5). Despite low birth weight
worsening in both population groups, the disparity between them has increased
slightly.
Graph 4: Low birth weight babies 1994
- 2000
Aboriginal and Torres Strait Islander rates
of low birth weight babies are greater than those in some low development
countries according to the Human Development Index collated by the United
Nations Development Program. Graph 5 shows how Aboriginal and Torres Strait
Islander rates compare with those in the UN Human Development Index.
Graph
5: Low birth weight babies, international comparisons (2000) 40
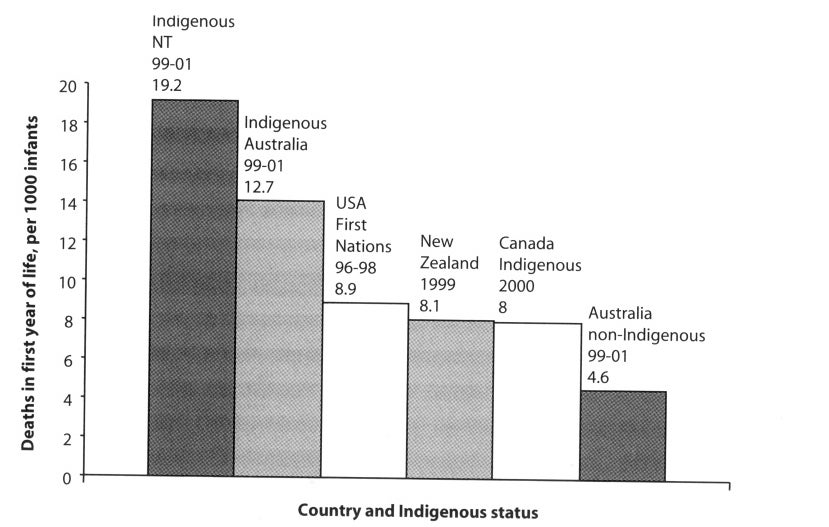
(e) Infant health - Infant mortality
Infant mortality is a death that occurs
in the first year of life. It can reflect poor infant and mother health.
Graph 6 shows that approximately 2.5 times as many Aboriginal or Torres
Strait Islander infants die before their first birthday as non-Indigenous
children. The infant mortality rate for Indigenous children in the Northern
Territory is four times the national rate.
Graph
6: Infant mortality Australia, 1993 - 200141
Because of the fluctuations in birth rate,
no reliable trend is evident. However, the data suggests a widening in
the disparity between the two groups since the mid 1990s as illustrated
in Table 7. Note that the ABS calculates the Indigenous figure over three
year periods, whereas the national figure is calculated annually.
Table 7: Disparity in the infant mortality
rate (IMR) 42
|
|
1995-7 | 1996-8 | 1997-8 | 1998-2000 | 1999-2001 |
| Indigenous IMR | 12.8 | 12.7 | 13 | 13.5 | 12.7 |
| National IMR | (1996) 5.8 | (1997) 5.3 | (1998) 5.0 | (1999) 5.7 | (2000) 5.2 |
| Disparity in IMRs | 7 | 7.4 | 8 | 7.8 | 7.2 |
Approximately thirty years ago, Indigenous
peoples in countries such as Canada, New Zealand and the United States
of America suffered similarly high infant mortality rates. However, these
countries have significantly reduced the rates of infant mortality in
recent decades, as shown in Graph 7.
Graph 7: Infant mortality and Indigenous
peoples, international comparisons (selected years) 43
(f) The six main causes of death of Aboriginal and
Torres Strait Islander peoples
Table 8 sets out the six main causes of
death for Aboriginal and Torres Strait Islander peoples in the period
1999 to 2001. These causes of death are presented as 'Standardised mortality
ratios' (or SMRs). These are calculated by first determining the number
of deaths per 1,000 head of population caused by a particular illness
or disease, and then expressing this as a ratio of deaths from the same
causes in a different population group. 44
Table 7 shows that 11.7 times more Indigenous
females (compared with non-Indigenous females) and 7.9 times more Indigenous
males (compared with non-Indigenous males) die of endocrine, nutritional
and metabolic diseases such as diabetes; and 4.8 times more Indigenous
females and males die of diseases of the digestive system. Indigenous
people are also significantly over-represented in deaths caused by respiratory
diseases, neoplasms (such as cancers), diseases of the circulatory system
(including heart disease), and external causes such as accidents and suicide.
Table
8: Standardised mortality ratios for the six main causes of death for
Aboriginal and Torres Strait Islander people45
| Cause | ATSI Female SMR | ATSI Male SMR |
| Diseases of circulatory system (inc. heart disease) |
2.8: 1 | 3.2: 1 |
| External causes (inc. accidents, suicide etc) |
3.2: 1 | 2.9: 1 |
| Neoplasms (inc. cancers) | 1.6: 1 | 1.6: 1 |
| Diseases of respiratory system | 3.9: 1 | 4.4: 1 |
| Endocrine, nutritional and metabolic diseases (inc. diabetes) |
11.7: 1 | 7.9: 1 |
| Diseases of the digestive system | 4.8: 1 | 4.8: 1 |
The ABS has demonstrated the impact of these
six causes of death on life expectancy for Indigenous peoples. It has
sought to calculate the impact of eliminating the disparities experienced
by Aboriginal and Torres Strait Islander peoples in relation to these
six causes of death. The years of life expectation gained is shown in
table 9. Note that given the complex interaction between diseases and
causes of death, the impact would not necessarily be cumulative. 46
Table 9: Potential years of life expectancy
gained by Aboriginal and Torres Strait Islander people if selected causes
of death reduced to that of the total population 1998 - 200047
| Cause | Male - years of life expectation gained |
Female - years of life expectation gained |
| Diseases of the circulatory system |
6.5 | 6.4 |
| External causes | 3.7 | 1.7 |
| Malignant neoplasms | 2.4 | 2.5 |
| Diseases of the respiratory system |
2.0 | 1.7 |
| Endocrine, nutritional and metabolic disease |
1.6 | 2.5 |
| Diseases of the digestive system |
1.0 | 0.8 |
(g) Health risk factors
In 2001, the ABS National Health Survey
classified 63% of Aboriginal and Torres Strait Islander people over 15
years of age as overweight or obese compared with 50% of non-Indigenous
people. The proportion of the population in both groups defined as overweight
or obese has increased since 1995. 48 Excess
body weight is a risk factor for diabetes, heart disease and other conditions.
The Survey reported 49% of Aboriginal and
Torres Strait Islander people aged 18 years and over were smokers, compared
with 24% of the general population. 49 Smoking
is a risk factor for coronary heart disease, stroke and cancers. Generally,
Aboriginal and Torres Strait Islander people are less likely to consume
alcohol than non-Indigenous people. The Survey reported 56% of Indigenous
respondents did not drink alcohol, compared with 38% of non-Indigenous
respondents. 10% of Aboriginal and Torres Strait Islander people were
likely to consume alcohol at risk or high risk levels, compared with 11%
of non-Indigenous people. 50 However, this
finding contrasts with other surveys that report Aboriginal and Torres
Strait Islander people consuming alcohol at risk levels twice that of
the non-Indigenous community. 51
Income
(a) Household income
Estimates of household income are adjusted
by the Australian Bureau of Statistics according to 'equivalence factors'
in order to recognise the impact of different household compositions and
different household sizes52 .
In 2001, the mean (or average) equivalised
gross household income for Aboriginal and Torres Strait Islander people
was $364 per week, or 62% of the rate for non-Indigenous people ($585
per week). The ABS has stated that 'this disparity reflects the lower
household incomes received by households with Indigenous person(s), and
the tendency for such households to be larger than other households and
hence for the equivalised gross household income to be lower'53 .
For Indigenous persons, income levels generally
decline with increased geographic remoteness. In major cities and regional
areas, average equivalised incomes for Indigenous persons were approximately
70% of the corresponding income for non-Indigenous persons. This declines
to approximately 60% in remote areas, and just 40% in very remote areas. 54
Between 1996 and 2001, average equivalised
gross household income for Indigenous persons rose by 11% (after adjustment
for inflation using the Consumer Price Index) compared with 13% for non-Indigenous
persons. As a consequence, the relative income disparity between Indigenous
and non-Indigenous persons slightly increased over the five year period
(with Indigenous persons earning 62% the non-Indigenous rate in 2001,
compared with 64% in 1996) 55 .
(b) Individual income
The median weekly gross individual income
for Indigenous people in 2001 was $226 (a $36 or 19% increase from the
1996 rate). This compares to $380 for non-Indigenous people in 2001 (an
increase of 28.4% from the 1996 figure of $296). 56
The disparity between Indigenous and non-Indigenous
people increased noticeably in relation to individual income over the
decade 1991 - 2001. The Centre for Aboriginal Economic Policy Research
have estimated that median individual income for Indigenous adults, expressed
as a ratio to non-Indigenous adult income, fell from 0.70 in 1991 to 0.65
in 1996 to 0.59 in 2001 (where 1.0 indicates a situation of equality or
parity). 57
Much of the difference is due to the large
numbers of Aboriginal and Torres Strait Islander people who derive their
income from unemployment benefits or who are engaged in Community Development
Employment Projects. There are also a larger number of Aboriginal and
Torres Strait Islander people in lower-skilled jobs. The ABS has also
noted that Indigenous persons tend to earn less money than non-Indigenous
persons within the same occupational categories. For example, in 2001
the median income of Indigenous persons in managerial positions was 81%
of the non-Indigenous median; for professionals it was 73% and among labourers
just 53%.58
Employment
(a) Participation in the labour force
In the 2001 Census, 52% of Indigenous people
aged 15 years and over reported that they were participating in the labour
force (meaning that they were engaged in mainstream employment, participating
in CDEP or unemployed). This compares to 53% in 1996. The participation
rate was higher for Indigenous men (60%) than Indigenous women (45%).
The labour force participation rate for
non-Indigenous people was 63% in 2001 (i.e. 11% higher than for Indigenous
people). When adjusted to include only people aged 15-64 years, the disparity
in labour force participation widens further with 54% of Indigenous people
in this age group in the labour force compared with 73% of non-Indigenous
people.
Table 10 shows that labour force participation
rates for Indigenous people declines with remoteness, with a 57% participation
rate in major cities compared with 46% in very remote areas. 59
Table
10: Labour force participation, by remoteness, 200160
| Indigenous Australians | Non-Indigenous Australians |
|
| Major cities | 57.3 | 64.3 |
| Inner Regional | 52.0 | 59.9 |
| Outer regional | 50.7 | 63.3 |
| Remote | 50.5 | 71.8 |
| Very remote | 46.2 | 78.1 |
Nationally, 46% of all Indigenous people
aged 15-64 years were not in the labour force in 2001. This indicates
that they were not actively engaged in the labour market, for reasons
including carer responsibilities, illness, disability or lack of market
opportunities. By comparison, 27% of non-Indigenous people in the same
age group were not participating in the labour force. 61
(b) Unemployment
The unemployment rate is the number of people
unemployed expressed as a proportion of the total labour force. The ABS
does not classify participation in the CDEP scheme as unemployed.
In 2001, the unemployment rate for Aboriginal
and Torres Strait Islander peoples was 20%. The rate in 1996 was 23%.
This is approximately three times higher than the rate for non-Indigenous
Australians. 62
Table 11 shows the unemployment rate for
Indigenous and non-Indigenous Australians by remoteness. It shows that
Indigenous people living in inner and outer regional areas have the highest
unemployment rate. The low rate of unemployment in very remote areas relates
to low levels of labour force participation, combined with high levels
of CDEP participation ad limited mainstream labour market opportunities.
Table 11: Unemployment rates by remoteness,
200163
| Indigenous Australians |
Non-Indigenous Australians |
|
| Major cities | 20.1 | 6.9 |
| Inner Regional | 25.0 | 8.1 |
| Outer regional | 23.1 | 7.4 |
| Remote | 19.2 | 4.9 |
| Very remote | 8.3 | 3.5 |
Table 12 shows that unemployment rates were
highest for Indigenous people aged 15-17 years (31.8%), and 18-24 years
(27.3%). These rates were approximately double the non-Indigenous rate.
Table 12: Unemployment rates by age
group, 200164
| Indigenous Australians |
Non-Indigenous Australians |
|
| 15-17 Years | 31.8 | 16.3 |
| 18-24 Years | 27.3 | 12.8 |
| 25-34 Years | 20.7 | 7.1 |
| 35-44 Years | 16.0 | 5.7 |
| 45-54 years | 11.7 | 4.9 |
| 55-64 Years | 10.4 | 5.7 |
(c) Employment and CDEP Participation
Indigenous people employed in 2001 had the following characteristics:
- 93% were employees, with four per cent self-employed
and two per cent employers; - 55% worked in the private sector and 23% in government;
- 52% were full time and 38% part time;
- 60% worked in low skill occupations, 21% in medium skill
occupations and 15% in high skill occupations; - 29% reported having a non-school qualification. 65
In 2001, 18% of all Indigenous people who
were classified as employed were engaged in Community Development Employment
Projects (CDEP). The CDEP Scheme enables participants to exchange unemployment
benefits for opportunities to undertake work and training in activities
managed by local Indigenous community organisations. Compared with all
Indigenous people who were employed, Indigenous people identified as CDEP
participants were:
- twice as likely to work part time (74% compared with
38%); - more likely to report working in a low skilled occupation
(79% compared with 60%); and - one third as likely to report having a non-school qualification
(nine per cent compared with 29%).66
Education
The 1994 National Aboriginal and Torres
Strait Islander Survey demonstrated that the lack of secondary and tertiary
qualifications impacts negatively on an Indigenous person's ability to
obtain ongoing, gainful employment67 . The
Centre for Aboriginal Economic Policy Research (CAEPR) also notes that
if Indigenous Australians do not 'keep up' with the rest of the Australian
population in educational attainment this will result in Indigenous Australians
being less competitive in the labour market and increase the risk of continuing
the cycle of severe poverty and disadvantage. 68
CAEPR reports there have been absolute improvements
in Indigenous education outcomes such as Indigenous post-secondary education
qualification rates between 1986 and 2001. They caution however that:
It is of concern that relative to the rate of improvement
for non-Indigenous Australians there has been little or no gain. This
relative lack of improvement occurs not only in the proportion of the
population with post-secondary qualifications, but also in the proportion
of Indigenous teenagers staying at school. By any measure the Indigenous
population remains relatively disadvantaged. 69
(a) Secondary education
Table13 below compares the highest level
of secondary schooling completed by Indigenous and non-Indigenous people.
It shows that 39.5 per cent of non-Indigenous Australians had completed
Year 12 or equivalent compared with 16.8 per cent of Indigenous Australians.
Further, one per cent of non-Indigenous Australians reported that they
did not go to school compared with three per cent of Indigenous Australians.
Table
13: Highest level of schooling completed, 200170
| Indigenous students (%) |
Non-Indigenous students (%) |
|
| Year 8 or below | 16.8 | 9.4 |
| Year 9 or equivalent | 13.8 | 7.6 |
| Year 10 or equivalent | 27.0 | 24.5 |
| Year 11 or equivalent | 9.2 | 9.9 |
| Year 12 or equivalent | 16.8 | 39.5 |
| Still at school | 5.1 | 3.5 |
| Did not go to school | 3.0 | 1.0 |
| Not stated | 8.4 | 4.6 |
Table 14 below shows the noticeable difference
between Indigenous and non-Indigenous students' transition to non-compulsory
Year 11 schooling. The retention rate for Indigenous students fell from
nearly 90% in year 10 to 67% in year 11. By comparison, the rate for non-Indigenous
students falls less dramatically from year 10 to year 11 from nearly 99%
to 90%.
Table 14: Grade progression rates,
200171
|
Year
level |
Indigenous students (%) | Non Indigenous students (%) |
|
8-9
|
96.1 | 99.8 |
|
9-10
|
89.7 | 98.6 |
|
10-11
|
67.6 | 89.4 |
|
11-12
|
66.6 | 86.5 |
Graph 8 below indicates that there has been
an increase in Year 12 retention rates for Indigenous students from 1997
to 2001 from 32% to 36% respectively. These rates remain substantially
lower than the rates for non-Indigenous students.
Graph 8: Apparent year 12 retention rates
for Indigenous and non-Indigenous students from commencement of secondary
school72

(b) Post-secondary education
Census data for 2001 identifies people aged
over 15 years who were attending a technical or further educational institution
(such as a TAFE college) or a university or other higher educational institution.
The ABS has reported that Indigenous people participate at a similar rate
to non-Indigenous people in post-secondary education, although this varies
across age groups, type of institution attended and across geographic
regions.
Indigenous people were more likely to attend
a TAFE and less likely to be attending university. Five per cent of all
Indigenous people aged over 15 years attended TAFE in 2001, compared with
three per cent of the non-Indigenous population. However, when this figure
is restricted to people aged 15-17 years and excludes people still attending
school, 14% of Indigenous people were attending TAFE compared with 22%
of non-Indigenous people of the same age. Attendance rates at TAFE for
Indigenous students aged 18-24 years were also lower than for non-Indigenous
students (8% and 11% respectively). 73
Indigenous people aged 15 years and over
were less likely than non-Indigenous people of the same age groups to
attend university (three compared with five per cent ). For Indigenous
peoples aged 18-24 years, this rate is significantly lower than for non-Indigenous
people (five and 23% respectively). 74
Table 15 below shows that Indigenous people
are also less likely to have a post-graduate degree, bachelor degree,
advanced diploma or diploma than non-Indigenous people.
Table
15: Highest non-school qualification, Percentage of persons aged 15 years
and over, 200175
| Indigenous people (%) | Non-Indigenous people (%) | |
| Postgraduate degree | 0.28 | 1.91 |
| Bachelor degree | 2.26 | 10.23 |
| Graduate Diploma | 0.36 | 1.44 |
| Advanced diploma / Diploma | 2.49 | 6.29 |
| Certificate | 9.38 | 16.43 |
| Other / Level not determined | 2.76 | 3.56 |
| No qualification | 72.14 | 55.30 |
| Not stated | 10.33 | 4.84 |
Housing and homelessness
(a) Housing tenure
Households with Aboriginal or Torres Strait
Islanders were much more likely to be renting than purchasing a home,
or owning a home outright. Table 16 shows that 63% of households with
Indigenous people were renting (compared with approximately 27% of other
households); 19% were purchasing their home (compared with 27% of other
households); and 13% owned their home outright (compared with 40% of other
households).
Table 16: Housing Tenure, 200176
| Households with Indigenous persons |
Other households | |
| Renting | 63.5 | 26.6 |
| Purchasing | 19.4 | 27.0 |
| Owner | 12.6 | 40.5 |
| Other / not known | 4.5 | 5.9 |
Generally speaking, in remote areas, Aboriginal
and Torres Strait Islander people are less likely to own their home than
in urban centres. This, in part, reflects the type of tenures available
to people on traditional Aboriginal and Torres Strait Islander lands.
(b) Household size and overcrowding
Households with Indigenous persons tend
to have more residents than other households. At the 2001 Census, there
was an average of 3.5 persons in households with Indigenous people, compared
with 2.6 persons in other households.
A measure of over-crowding is the availability
of bedrooms for household residents. 16% of Indigenous households were
accommodated in dwellings that required at least one extra bedroom, compared
with three per cent of other households.
Both household size and the proportion of
households requiring at least one additional bedroom rose with increased
geographic remoteness. Average household size increased from 3.2 residents
in major cities to 5.3 in very remote areas. Table 17 shows that the proportion
of households requiring at least one extra bedroom rose from 11% in major
cities and inner regional areas to 46% in very remote areas. By comparison,
the rate of other households requiring at least one additional bedroom
does not reach four per cent in any geographic region.
Table
17: Households requiring an extra bedroom, by Indigenous status and remoteness,
200177
| Indigenous Australians | Non-Indigenous Australians | |
| Major cities | 11.0 | 3.8 |
| Inner Regional | 10.9 | 2.5 |
| Outer regional | 14.7 | 2.8 |
| Remote | 21.5 | 3.2 |
| Very remote | 45.8 | 3.9 |
The Steering Committee for Government Service Provision
has reported that Indigenous people were 5.6 times more likely to live
in overcrowded houses than non-Indigenous people. This rate rises to 18.8
times the non-Indigenous rate in very remote areas. 78
(c) Discrete Aboriginal and Torres Strait Islander
communities
'Discrete' Aboriginal and Torres Strait
Islander communities are those that comprise largely, or only, Aboriginal
and Torres Strait Islander people. They are located in both urban and
remote areas. Conditions in these communities were until very recently
far poorer than conditions in non-Indigenous communities. The Community
Housing and Infrastructure Needs Surveys (CHINS) have been carried out
every two years since 1997 by the ABS. They are commissioned by ATSIC.
They aim to provide a picture of life in discrete communities and allow
government programs to improve conditions there to be monitored.
A total of 1,216 discrete Aboriginal or
Torres Strait Islander communities were covered in the 2001 CHINS, These
communities had 16,960 permanent dwellings and a total reported population
of 108,085. 79
While many problems with housing and infrastructure
in discrete Indigenous communities were reported, a number of improvements
since the 1999 CHINS were observed. These include a reduction in the proportion
of people living in temporary dwellings, an increase in the proportion
of permanent dwellings connected to water, power and sewerage systems
and a reduction in sewerage system overflows and leakages.
Selected findings in relation to discrete
Indigenous communities were that water quality was either not tested,
or had failed testing in the 12 months prior to the survey, in 46% of
the 213 Indigenous communities which had a population of 50 or more and
were not connected to a town water supply. This is a decrease from 52%
of such communities in 1999. 80 Further,
overflows or leakages from sewerage systems in the 12 months prior to
the survey occurred in 48% of Indigenous communities with a population
of 50. 81
Aboriginal
and Torres Strait Islanders and criminal justice systems
The Royal Commission into Aboriginal Deaths
in Custody reported in 1991. In the 12 years since there has been little
progress in reducing the level of contact of Indigenous peoples with criminal
justice processes.
(a) Indigenous adult prisoners
In 1991, Indigenous people made up 14% of
the total prison population. Consistently since 1999 Indigenous peoples
have constituted approximately 20% of the prison population. 82 Figures for 1991-2002 are shown in Graph 10 below.
Graph 9: Aboriginal
and Torres Strait Islander prisoners in Australia 1992 - 2002

In June 2003, the highest rate of imprisonment
for Indigenous persons was recorded in Western Australia (2,846 Indigenous
persons per 100,000 adult Indigenous population) followed by New South
Wales (2,128), the Northern Territory (1,768) and Queensland (1,710).
The Northern Territory recorded the highest proportional increase in the
Indigenous rate of imprisonment (33%) between the June quarters 2002 and
2003. Western Australia recorded the next highest proportional increase
(12%). Tasmania, Queensland and Victoria recorded decreases in the Indigenous
rate of imprisonment since the June quarter 2002 of 18%, three per cent
and two per cent respectively. Nationally, the Indigenous rate of imprisonment
was 16 times the non-Indigenous rate. The highest ratios of Indigenous
to non-Indigenous rates of imprisonment were recorded in Western Australia
and New South Wales with Indigenous rates of imprisonment 22 and 17 times
the non-Indigenous rates respectively83 .
On 30 June 2002, the night of the annual
National Prisoner Census, there were 4,494 Indigenous prisoners in Australia.
This is a rate of 1,806 prisoners per 100,000 population (compared with
148 prisoners per 100,000 for the total Australian population) 84 . The age profile of Indigenous prisoners is younger than for the total
prisoner population, with a median age of 28.9 years (compared with 31.2
years for all prisoners). On 30 June 2002, nearly six per cent of Indigenous
males aged 25-29 years were in prison (compared with 0.6% of all males
aged 25-29 years) 85 .
A recent study in the state of New South
Wales demonstrates the extent of contact of Indigenous people with criminal
justice processes. Between 1997 and 2001, a total of 25,000 Indigenous
people appeared in a NSW Court charged with a criminal offence. This constitutes
28.6% of the total NSW Indigenous population. In the year 2001 alone,
nearly one in five Indigenous males in NSW appeared in Court charged with
a criminal offence. For Indigenous males aged 20-24 years, this rate increased
to over 40%.86
Recent statistics for the Northern Territory
also indicate that Aboriginal people constitute between 75-78% of all
prisoners, and up to 82% of juveniles in detention in the Territory in
the 2002-2003 year. 87
(b) Indigenous women in corrections
Since the Royal Commission, the greatest
relative increase in incarceration has been for Indigenous women. The
Indigenous female prison population increased by 262% between 1991 and
1999 (compared with an increase in non-Indigenous women of 185%). In June
2003, Indigenous women were incarcerated at a rate 19.3 times that of
non-Indigenous women. The highest rates of incarceration for Indigenous
women were recorded in Western Australia (428.6 per 100,000), New South
Wales (383.1 per 100,000) and South Australia (286.3 per 100,000). 88
Graph 10: Aboriginal
and Torres Strait Islander female prisoners 1995 - 200189

(c) Indigenous juveniles and corrections
Indigenous juveniles (up to age 18) remain
over-represented in criminal justice processes. Since 1997, Indigenous
juveniles have consistently constituted 42% of all juveniles in detention
nationally despite comprising less than four per cent of the total juvenile
population90 . In June 2002, Indigenous
juveniles were detained at a rate almost 19 times that of non-Indigenous
juveniles91 . This compares to a rate of
13 times the non-Indigenous rate in 1993. Juvenile detention rates nationally
are on the decline. Since 1998, rates of detention for Indigenous juveniles
have declined faster than rates for non-Indigenous juveniles92 .
A recent study in Queensland has tracked
the criminal trajectory of young offenders who have appeared in the juvenile
justice system from 1994-95 onwards. The study tracks their rate of entry
into the adult court system (through custodial and non-custodial orders
served up to September 2002) 93 . The study
reported 86% of Indigenous juveniles who had been on supervised orders
progressed to the adult criminal justice system (compared with 75% of
non-Indigenous juveniles) and that 65% served a prison term (compared
with 41% of non-Indigenous juveniles). By September 2002, 89% of Indigenous
male juveniles on supervised orders had progressed to the adult system,
with 71% having served at least one term of imprisonment.
The study reported there was an increased
likelihood that those juveniles who were subject to a supervised justice
order and had been the subject of a care and protection order would proceed
to the adult criminal justice system, with 91% of all such juveniles having
some contact with the adult system, and 67% having served at least one
term of imprisonment94 . The study concluded
that 'over time, the probability of those juveniles on supervised orders
in 1994-95 who are subject to multiple risk factors (e.g. male, Indigenous,
care and protection order) progressing to the adult corrections system
will approach 100 per cent.' 95
(d) Aboriginal and Torres Strait Islander deaths in
custody
In the decade from 1990-1999, 115 Indigenous
people died in custody. A significant feature of these deaths was that
there were significantly fewer deaths in police custody (as opposed to
in prisons) which tends to indicate that the implementation of recommendations
of the Royal Commission relating to conditions and design of police custody
had some impact96 . Despite these improvements,
Indigenous deaths in custody over the past decade still represented 18%
of all deaths in custody. This figure has risen from 2000-2002 to 20%
of all deaths in custody. In 2002, there were 14 Indigenous deaths in
custody. 97
(e) Victims of crime
There is no national data on the extent
to which Indigenous peoples are victims of crime. A study in New South
Wales in 2001 reported that Indigenous people are 5.5 times more likely
(6.2 times for Indigenous females) than non-Indigenous people to be a
victim of a domestic violence related assault; 3.4 times (rising to 5.2
times for Indigenous females) more likely to be the victim of assault;
2.8 times (2.9 for Indigenous females) more likely to be the victim of
a sexual assault; 2.5 times (1.9 for Indigenous females) more likely to
be the victim of murder; 1.4 times (same for Indigenous females) more
likely to be the victim of a sexual assault against a child aged 0-15
years. Indigenous people were, however, less likely to be the victim of
robbery. The study also reported that victimisation in violent crimes
is also predominately the result of offending by other Aboriginal people. 98 This identifies the challenge to find
solutions for Indigenous people being victims of crime, within the context
of addressing the over-representation of Indigenous people in criminal
justice processes.
A study in Western Australia in 2001 reported
Indigenous people were nearly seven times more likely to be a victim of
assault (and nearly 13 times for Indigenous females); seven times more
likely to be a victim of homicide; and 3.2 times more likely to be a victim
of sexual assault (rising to 3.3 times for Indigenous females) 99 .
Child protection
There are three areas of child protection services for which
national data is compiled:
- Child protection notifications, investigations and substantiations;
- Children on care and protection orders; and
- Children in out-of home care.
Children who are perceived to be in need
of protection can come into contact with community services departments
or child protection agencies (in the states and territories) by someone
expressing concern about the welfare of a child or making a report to
the department. From the reporting stage, if it is decided that the child
is prima facie under risk of harm (neglect or abuse) the report is classified
as a notification. Most notifications are investigated and classified
as substantiated or not substantiated according to the degree of risk
to the child. A range of services are then provided to that child and
the child's family. In extreme cases, state departments can apply to the
court for a care and protection order. Children can also be placed in
out-of-home care, either temporarily or more long term, by order of the
court100 .
(a) Child protection notifications, investigations
and substantiations
In 2001-02, Aboriginal and Torres Strait
Islander children (aged 0-16 years) were more likely to be the subject
of a substantiation that non-Indigenous children in all states and territories
except Tasmania. Table 18 below shows that the rate of Indigenous children
who were the subject of a substantiation was 7.9 times higher than the
rate for non-Indigenous children in Western Australia and Victoria; 7.2
times in South Australia; and 3.6 times in New South Wales.
Table 18: Rate of children the subject
of substantiations: By Indigenous status and state / territory, 2001-02101
|
State/Territory
|
Indigenous (rate
per 1,000) |
Non- Indigenous
(rate per 1,000) |
Indigenous to
Non-Indigenous Ratio |
|
NSW
|
15.3
|
4.3
|
3.6
|
|
Vic
|
48.1
|
6.1
|
7.9
|
|
Qld
|
14.3
|
7.9
|
1.8
|
|
WA
|
13.5
|
1.7
|
7.9
|
|
SA
|
31.6
|
4.4
|
7.2
|
|
NT
|
9.7
|
3.2
|
3.0
|
|
Tas
|
0.3
|
2.6
|
0.2
|
|
A.C.T
|
6.5
|
2.6
|
2.5
|
The pattern of substantiated abuse and neglect
for Aboriginal and Torres Strait Islander children differs from the pattern
for other children. Indigenous children were much more likely to be the
subject of a substantiation of neglect. For example, in Western Australia
50% of substantiations for Indigenous children were of neglect (compared
with 24% of other children). 102
(b) Children on care and protection orders
There were 4,264 Aboriginal and Torres Strait
Islander children on care and protection orders nationally on 30 June
2002. This translates to a rate of 20.5 Indigenous children per 1,000.
The rate for the rest of the population is 3.5 per 1,000. The rate for
Indigenous children is 5.9 times the non-Indigenous rate.
Table 19 shows the rate of Indigenous children
on care and protection orders across all states and territories, and comparisons
to the rate for other children. It shows that the rate per 1,000 children
is 10.4 times the non-Indigenous rate in Victoria; 8.0 times the rate
in New South Wales; 7.9 times the rate in Western Australia; and 6.5 times
the rate in South Australia.
Table 19: Rate of children on care
and protection orders: By Indigenous status and state / territory, 2001-02103
| State/Territory | Indigenous (rate per 1,000) | Non- Indigenous (rate per 1,000) | Indigenous to Non-Indigenous Ratio |
| NSW | 31.9 | 4.0 | 8.0 |
| Vic | 40.6 | 3.9 | 10.4 |
| Qld | 15.1 | 3.3 | 4.6 |
| WA | 15.7 | 2.0 | 7.9 |
| SA | 20.3 | 3.1 | 6.5 |
| NT | 5.2 | 1.9 | 2.7 |
| Tas | 2.8 | 4.0 | 0.7 |
| A.C.T | 18.1 | 2.9 | 6.2 |
| Nationally | 20.5 | 3.5 | 5.9 |
(c) Children in out of home care
At 30 June 2002, there were 4,199 Aboriginal
and Torres Strait Islander children in out-of-home care, an increase of
126 on the previous year. The rate of Aboriginal and Torres Strait Islander
children in out-of-home care was 20.1 per 1,000 (compared with 3.2 per
1,000 for other children). In all states and territories except Tasmania
the rate of Indigenous children in out-of-home care was higher than for
other children104 . Table 20 shows the
rates per 1,000 for Indigenous and non-Indigenous children and the ratio
of Indigenous to non-Indigenous children in out-of-home care. The ratio
for Indigenous to non-Indigenous children was highest in Victoria, NSW,
WA and SA.
Table 20: Rate of children in out-of-home
care: By Indigenous status and state / territory, 2001-02105
| State/Territory | Indigenous (rate per 1,000) | Non- Indigenous (rate per 1,000) | Indigenous to Non-Indigenous Ratio |
| NSW | 33.5 | 3.8 | 8.8 |
| Vic | 39.0 | 3.0 | 13.0 |
| Qld | 12.2 | 2.9 | 4.2 |
| WA | 17.1 | 2.2 | 7.8 |
| SA | 20.2 | 2.8 | 7.2 |
| NT | 4.4 | 1.6 | 2.8 |
| Tas | 3.6 | 4.6 | 0.8 |
| A.C.T | 15.3 | 2.5 | 6.1 |
| Nationally | 20.1 | 3.2 | 6.3 |
At 30 June 2002, 79% of Indigenous children
placed in out-of-home care across Australia were placed in accordance
with the Aboriginal Child Placement Principle. This Principle outlines
a preference for placing Indigenous children with an Indigenous family.
It places a preference for placements first with their extended families,
second with their Aboriginal or Torres Strait Islander community and third
with Indigenous people before placing the child with a non-Indigenous
family. 106
Further information and links
The National Centre for Aboriginal and Torres
Strait Islander Statistics (NCATSIS) within the Australian Bureau of Statistics
(ABS) http://www.abs.gov.au/ is the
single most important source of data about Aboriginal and Torres Strait
Islander peoples in Australia. They collect data through both Indigenous-specific
and general surveys, including:
- The Census of Population and Housing,
which take place every five years, the most recent being in 2001 and
the next in 2006. Although this is not an Indigenous-specific survey,
the 2001 Census form was completed by approximately 410,000 people who
identified as Indigenous, making it the most comprehensive survey undertaken
of Indigenous people in Australia. Disaggregated results are available,
with comparisons to the non-Indigenous or total population. Publications
titled Population Characteristics, Aboriginal and Torres
Strait Islander Australians (with ABS Series cat. 4713.0 - 8) summarise
the main findings at national and State/Territory levels. - The Indigenous General Social Surveys (IGSS) are the largest Indigenous-specific surveys undertaken by the
ABS. The first was in 2002 and they are intended to occur at six yearly
intervals. The results of the 2002 Survey will be available in April,
2004. The IGSS aims to provide information across all areas of social
concern for the Indigenous population, including health, housing, work,
education, and income. The survey is to have a sample of about 11,000
Indigenous people spread across all areas, designed to produce estimates
at State/Territory level and broad regional data (eg metropolitan, urban,
other) at the national level. See also the National Aboriginal
and Torres Strait Islander Survey (1994) (NATSIS). - The Community Housing and Infrastructure Surveys (CHINS), commissioned by ATSIC from the ABS. The first CHINS took place
in 1992, with follow-ups in 1999 and another in 2001. They are now intended
to take place every two years. These have two specific aims. One, to
assess the state of the housing stock of Indigenous housing authorities,
and two, to assess the housing and Infrastructure in ‘discrete’
Indigenous communities – defined areas whose population is 50%
or more Indigenous. The latter is the most useful because it sheds light
on the conditions under which approximately 108,000 Indigenous people
live in Australia (about 1 in 4 people) most in remote areas. The results
are published in an ABS series with cat. no. 4710.0 Housing and
Infrastructure in Aboriginal and Torres Strait Islander Communities,
Australia. - The National Health Surveys have been
taking place since 1995 and have included an Indigenous identifier.
From 2001, the surveys have had an Indigenous component, although the
sample sizes are relatively small. These are intended to take place
every 3 years. Results from these are published in ABS series cat. no.
4806.0 National Health Survey: Aboriginal and Torres Strait Islander
Results. - The National Health Survey Results and
other data gathered from administrative data sets (hospital records,
birth and death certificates and so on) gathered by the Australian Institute
of Health and Welfare (AIHW) are published in a joint ABS/AIHW publication
series cat. no. 4704.0 The Health and Welfare of Australia’s
Aboriginal and Torres Strait Islander Population. These are released
every second year, the most recent in 2003. - Other ABS surveys include the National Drug Strategy, Household Survey (1998), the Labour Force Surveys (1994 on), and the Australian Housing Survey (1999). All of these have Indigenous components.
Recent publications and websites with significant
data collections/information about Indigenous issues include:
- The Steering Committee for the Review of Government Service
Provision’s report Overcoming
Indigenous Disadvantage: Key Indicators 2003. It is a particularly
useful source of comparisons of the socio-economic conditions of Indigenous
compared to non-Indigenous people in Australia, and will be updated
annually - The
Commonwealth Grants Commission’s Report on Indigenous Funding
2001. - The Centre for
Aboriginal Economic Policy Research, which conducts wide-ranging
analysis of Indigenous economic issues and statistics - The Australian Institute
of Criminology, which publishes a variety of statistics and monographs
relating to Indigenous people and criminal justice processes, including
deaths in custody - The Australian Institute
of Health and Welfare, which publishes significant data on child
protection, health and welfare. This includes through the biennial Australia’s
Health and Australia’s Welfare publications, as well as The
Health and Welfare of Australia’s Aboriginal and Torres Strait
Islander Population - The Commonwealth
Department of Education and Workplace Relations, which publishes
quarterly statistics on Indigenous employment outcome - The Department of Education,
Science and Training, which publishes an annual report to federal
Parliament on outcomes in Indigenous education - ATSIC
- Menzies School of
Health Research - Department
of Immigration, Multiculturalism and Indigenous Affairs
1. For a description of other data
collected on Aboriginal and Torres Strait Islander peoples, see the Australian
Bureau of Statistics, The Health and Welfare of Australia's Aboriginal
and Torres Strait Islander Peoples 2003, cat no 4704.0, Commonwealth
of Australia, Canberra, 2003, pp 231-2.
2. Steering Committee for the Review
of Government Service Provision, Overcoming Indigenous Disadvantage:
Key indicators 2003: Report, Productivity Commission, Canberra, 2003.
3. Australian Bureau of Statistics, op.cit, p 226.
4. Ibid, p 245.
5. Ibid, p 13.
6. Australian Bureau of Statistics, Population characteristics: Aboriginal and Torres Strait Islander Australians
2001, cat no 4713.0, Commonwealth of Australia, Canberra, 2003, p
15.
7. Ibid.
8. Ibid, p 19, Table 2.2.
9. Ibid, p 20.
10. Department of Immigration, Multiculturalism
and Indigenous Affairs, Indigenous people in Australia (Fact sheet)
Department of Immigration, Multiculturalism and Indigenous Affairs website,
http://www.minister.immi.gov.au/atsia/facts/index.htm (2 December, 2003).
11. Hunter, Kinfu, Taylor, The
future of Indigenous work: Forecasts of labour force status to 2011,
CAEPR Discussion paper no. 251/2003, Australian National University, Canberra,
2003, p2.
12. Australian Bureau of Statistics,
Population characteristics: Aboriginal and Torres Strait Islander Australians
2001, op.cit, p 20, Table 2.3.
13. Ibid, p 19, Table 2.1.
14. Ibid.
15. Ibid, p 19, Table 2.2.
16. Ibid, p 22, Table 2.5.
17. Ibid.
18. Ibid, p 27.
19. Ibid, p 28-29.
20. Ibid, p 35-36.
21. Australian Bureau of Statistics, National Aboriginal and Torres Strait Islander Survey 1994 - Detailed
Findings, cat no 4190.0, Commonwealth of Australia, Canberra, 1995,
p 9, Table 8.
22. The ABS produces two estimates
for the life expectation of Aboriginal and Torres Strait Islander people.
One is an 'observed' estimate, based directly on available data. However,
because of problems with data, it also produces an 'adjusted' estimate,
which it expects would be more accurate. Australian Bureau of Statistics, Deaths (2001), cat no 3302.0, Commonwealth of Australia, Canberra,
2002, p 102.
23. Ibid, p 101.
24. Australian Bureau of Statistics, Australian Institute of Health and Welfare, The Health and Welfare
of Australia's Aboriginal and Torres Strait Islander Peoples, 2001,
cat 4704.0, Commonwealth of Australia, 2001, p 121.
25. World Health Organisation, World
Health Report 2002: Overview, WHO, Geneva, 2002, http://www.who.int/whr/2002/overview/en/index1.html
(4 December, 2003).
26. United Nations Development Programme,
UN Human Development Report 2003, Oxford University Press, 2003, p 237.
27. Australian Bureau of Statistics,
Deaths, op.cit, p 102.
28. Ibid, p 101.
29. Comparing data from the following
sources: Ibid, p 101 (unnumbered table: Experimental Estimates
of Life Expectancy at Birth, Adjusted Life Expectancy) [Aboriginal and
Torres Strait Islander data, 1997-1999 and 1999-2001]; p 92, Table 6.51
[Aboriginal and Torres Strait Islander adjusted data for period 1998-2000];
p 76, Table 6.32: [General population data].
30. Ring, Forman, Reducing Indigenous
mortality in Australia; lessons from other countries, Medical Journal
of Australia website, 1998, http://www.mja.com.au/public/issues/nov16/ring/ring.html
(4 December 2003).
31. Australian Bureau of Statistics, Deaths, op.cit, p 92, Table 6.51 [Data for Aboriginal and Torres
Strait Islander people, New Zealand and the United States of America].
Statistics Canada, A Statistical Profile of the Health of First Nations
in Canada, p 16, Table 2.3.
32. Australian Bureau of Statistics, Deaths, op.cit, p 20.
33. Ibid, p 79, Table 6.35.
Note: Indigenous data for the period 1991-1997 excludes figures for NSW,
Queensland, Victoria and Tasmania.
34. Ibid.
35. Ibid, p 80. Note: Indigenous
data for the period 1991-1997 excludes figures for NSW, Queensland, Victoria
and Tasmania.
36. Ibid, p 20.
37. Australian Bureau of Statistics,
Australian Institute of Health and Welfare, op.cit, p 125.
38. Gray, Hunter, Taylor, Health
Expenditure, Income and Health Status among Indigenous and Other Australians,
CAEPR Research Monograph No 21, Australian National University, Canberra,
2002, p 38.
39. Australian Bureau Of Statistics
and Australian Institute of Health and Welfare, The Health and Welfare
of Australia's Aboriginal and Torres Strait Islander Peoples cat no
4704.0, Commonwealth of Australia, Canberra, 1999, p 86, Table 6.6 [1994
- 1996 data]; Australian Bureau Of Statistics and Australian Institute
of Health and Welfare: The Health and Welfare of Australia's Aboriginal
and Torres Strait Islander Peoples 2001, cat no 4704.0, Commonwealth
of Australia, Canberra, 2001, p 63, Table 5.5. [1996 - 1998]. Australian
Bureau Of Statistics and Australian Institute of Health and Welfare, The
Health and Welfare of Australia's Aboriginal and Torres Strait Islander
Peoples 2003, op.cit, p 126, Table 6.5. [1998 - 2000].
40. Australian Bureau of Statistics
and Australian Institute of Health and Welfare, The Health and Welfare
of Australia's Aboriginal and Torres Strait Islander Peoples 2003, op.cit,
p 126 [Indigenous]. United Nations Development Programme, op.cit, p 171 -173 [International comparisons].
41. Australian Bureau of Statistics, Deaths, op.cit, p 23, Table 3.7 [Indigenous national average];
p 71, Table 6.27, [National averages]. Note: the ABS calculates the Indigenous
figure over three year periods, whereas the national figure is calculated
annually.
42. Ibid.
43. Ibid, Australian Bureau
Of Statistics, Deaths, op.cit, p 93, Table 6.52 [Australia, New
Zealand, United States of America]; p23, Table 3.7 [Northern Territory]. Ibid, Statistics Canada, p 22 [Canada].
44. Australian Bureau of Statistics
and Australian Institute of Health and Welfare, The Health and Welfare
of Australia's Aboriginal and Torres Strait Islander Peoples 2003, op.cit,
p 181.
45. Ibid, p 192, Table 9.11.
46. Australian Bureau of Statistics, Australian Social Trends 2002, cat no 4102.0, Commonwealth of Australia,
Canberra, p 90.
47. Ibid.
48. Australian Bureau of Statistics, National Health Survey, Aboriginal and Torres Strait Islander Results,
Australia 2001, cat no 4715.0, p 33, Table 14.
49. Ibid.
50. Ibid.
51. Australian Bureau of Statistics
and Australian Institute of Health and Welfare, The Health and Welfare
of Australia's Aboriginal and Torres Strait Islander Peoples 2003, op.cit,
p 174.
52. For a full explanation of equivalisation
factors see Australian Bureau of Statistics, op.cit, Population
characteristics: Aboriginal and Torres Strait Islander Australians 2001,
p81.
53. Ibid.
54. Ibid, p 82.
55. Ibid.
56. Ibid, p 88, Table 7.2.
57. Altman, J and Hunter, B, Monitoring
'practical' reconciliation: Evidence from the reconciliation decade, 1991-2001,
Discussion Paper 254/2003, Centre for Aboriginal Economic Policy Research,
Canberra 2003, pp 5 -6, Tables 1 and 2.
58. Australian Bureau of Statistics, Population Characteristics: Aboriginal and Torres Strait Islander Australians
2001, op.cit, p 85.
59. Ibid, p 65.
60. Ibid, p 71,Table 6.1
61. Ibid, p 66.
62. Ibid.
63. Ibid, p 71, Table 6.1.
64. ibid, p 70, Table 6.2.
65. Australian Bureau of Statistics, Population Characteristics: Aboriginal and Torres Strait Islander Australians
2001, op.cit, p 68.
66. Ibid.
67. Australian Bureau of Statistics,
National Aboriginal and Torres Strait Islander Survey 1994,op.cit.
68. B.H Hunter and R.G Schwab, Practical
reconciliation and recent trends in Indigenous education, No. 249/2003,
Centre for Aboriginal Economic Policy Research, Australian National University,
p 18.
69. Ibid, p 14.
70. Australian Bureau of Statistics, Census of Population and Housing: Selected Indigenous Characteristics
2001, op.cit, p 57, Table 5.4.
71. Department of Education, Science
and Training, derived from National Schools Statistics Collection 4221.0,
Australian Bureau of Statistics, p 56.
72. Department of Education, Science
and Training, derived from National Schools Statistics Collection 4221.0,
Australian Bureau of Statistics, p 57.
73. Australian Bureau of Statistics, Population Characteristics: Aboriginal and Torres Strait Islander Australians
2001, op.cit, p 48.
74. Ibid.
75. Ibid, p 59, Table 5.6.
76. Australian Bureau of Statistics,
Population characteristics: Aboriginal and Torres Strait Islander Australians
2001, op.cit, 93 -94.
77. Ibid, p 105, Table 8.4.
78. Australian Bureau of Statistics, Census of Population and Housing: Selected Indigenous Characteristics
2001, op.cit, p 57, Table 5.4.
79. Australian Bureau of Statistics
and Australian Institute of Health and Welfare, The Health and Welfare
of Australia's Aboriginal and Torres Strait Islander Peoples 2003, op.cit,
p43
80. Ibid, p 46
81. Ibid, p 47
82. Australian Bureau of Statistics, Prisoners in Australia - 30 June 2002, Series: cat no 4512.0, Commonwealth
of Australia, Canberra, p33, Table 15
83. Australian Bureau of Statistics, Corrective Services - June 2003 Quarter, Series 4512.0, Commonwealth
of Australia, Canberra 2003, p 2-3
84. Australian Bureau of Statistics, Prisoners in Australia, 30 June 2002, cat no 4517.0, Commonwealth
of Australia, Canberra 2003, p 4.
85. Ibid, p 5.
86. Weatherburn, D, Lind, B, and
Hua, J, 'Contact with the New South Wales court and prison systems:
The influence of age, Indigenous status and gender' 78 Crime and Justice
Bulletin (NSW Bureau of Crime Statistics and Research) 1, 2003, pp 4-5,
www.lawlink.nsw.gov.au/bocsar1.nsf/pages/cjb78text
87. Northern Territory Government, Northern Territory Quarterly Crime and Justice Statistics, Issue 4:
June Quarter 2003, Office of Crime Prevention, Department of Justice,
Darwin, 2003 www.nt.gov.au/justice/ocp/pages/stats.shtml. (12 October
2003)
88. Australian Bureau of Statistics, Corrective Services - June Quarter 2003, op.cit, p 22.
89. Australian Bureau of Statistics Prisoners In Australia, Cat no 4517.0, Commonwealth of Australia,
Canberra, p 33, Table 15
90. Australian Bureau of Statistics
and Australian Institute for Health and Welfare, The Health and Welfare
of Australia's Aboriginal and Torres Strait Islander Peoples, op.cit,
pp 109-110.
91. Steering Committee for the Review
of Government Service Provision, op.cit, para 3.63.
92. Australian Institute of Criminology,
'Juvenile corrective institutions: Indigenous status' in Australian
Crime: Facts and Figures 2002, AIC Canberra 2002, www.aic.gov.au/publications/facts/2002/fig76.html
(15 October 2003)
93. Lynch, M, Buckman, J and Krenske,
L, Youth justice: Crime Trajectories, Australian Institute of Criminology
and Queensland Crime and Misconduct Commission, AIC Trends and Issues
in Crime and Criminal Justice, Issues Paper 165, September 2003, AIC Canberra
2003.
94. Ibid, p 4.
95. Ibid, p 2.
96. Aboriginal and Torres Strait
Islander Social Justice Commissioner, Social Justice Report 2001, op.cit,
Human Rights and Equal Opportunities Commission, Sydney, 2002, pp 15 -16.
97. Collins, L and Ali, M, Deaths
in Custody Australia - 2002, National Deaths in Custody Program Annual
Report, Australian Institute of Criminology, Canberra 2003, p 25.
98. Fitzgerald, J and Weatherburn,
D, 'Aboriginal Victims and Offenders: The Picture from Police Records',
NSW Bureau of Crime Statistics and Research, Sydney 2001, p1, www.lawlink.nsw.gov.au/bocsar1.nsf/pages/pub_atoc#aboriginality
(15 October 2003)
99. Steering Committee for the Provision
of Government Service Delivery, op.cit, Table 3.11.2.
100. For a detailed explanation
of care and protection classifications and statistics see: Australian
Institute of Health and Welfare, Child protection 2001-02, AIHW
Canberra 2003, Chapter 1.
101. Ibid, p 18, Table 2.9.
102. Ibid, p 18.
103. Ibid, p 34, Table 3.10.
104. Ibid, p 44.
105. Ibid, p 44, Table 4.8.
106. Ibid, pp 44-45,
Table 4.9.